StayActive
2014-2016. Stress and burn-out prevention through a smartphone. |
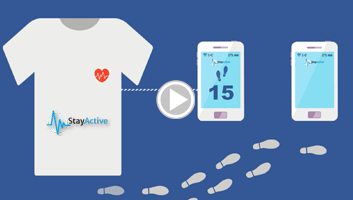
The StayActive international research project is a stress detection system designed for working people aged above 55. It collects bio-feedback signals from a T-Shirt, observes the behaviour of the user with his smartphone, and combines these data in order to compute the stress level of the user. Advice and relaxation games are then proposed to the user when necessary.

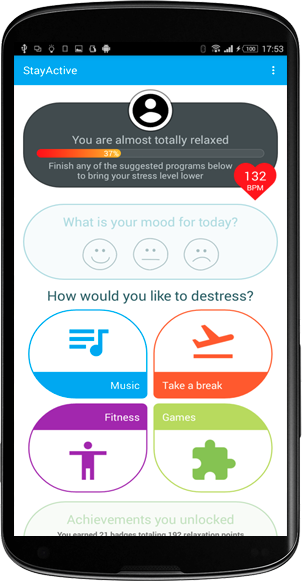
In this project, TaM was responsible to determine the stress level of the user only by analysing his behaviour with his smartphone. The idea was to propose a solution that is as less invasive as possible and that does not require any specific material. In other words, a solution that anybody can easily and freely try to have a first idea whether he is suffering from stress or not. In case of doubts, the user would then be invited to collect bio-feedback signals with the T-Shirt and obtain so a more accurate value about his stress level. The stress level is then presented to the end user as a "relaxation score", a term that is better accepted, and that is basically it's opposite: The higher your stress, the lower your relaxation score.

In order to test locally any new improvement of our system, we could benefit from a partnership with the Public Transportation Company of Geneva (TPG).
Innovation

The main contribution of TaM in this project was an innovative algorithm able to combine heterogeneous data coming from different sources in order to compute a single number, the relaxation score. We chose 3 of these different sources, called dimensions, which are:
- Sleeping pattern. We take into account the user's duration of sleep. We set the number of normal sleeping hours at 8 and penalize insufficient sleep and oversleeping. Between 6 p.m. and 10 a.m. we compute the biggest time interval that the user did not touch his screen and we infer the duration of his sleep.
- Physical activity. Our system monitors the physical activity of the user, making the distinction between the type of activity (e.g. walking, running, bicycling). We have also implemented a step counter which gives us the opportunity to find the number of steps that each user took per day.
- Social interaction. We take into account the number of touches of the screen (quantifying the usage of applications on the phone), the number of calls and the number of SMSs as factors for the social interaction of the users using their smartphones.
At first we compute a relaxation score for each individual user for every day of the monitoring month. The relaxation score is in the scale of [0-10] where the more stressed you are, the lower your score will be (so the more relaxed you are the higher your relaxation score). The idea of the scoring procedure is the same with the score assignment of the sub dimensions of the social interaction. We assign a weight factor to each of the three dimensions of wellbeing that we have taken into account in our study. This factor is based on the response of the participants to the following question which was asked in the beginning of the experiment. Which of the three dimensions do they personally consider as the most important for their wellbeing? To the most important dimension we assign a weight of w1 = 0.4 and to the rest we assign a weight of 0.3 respectively (w2 = w3 = 0.3), so that w1 + w2 + w3 = 1. Based on these factors we are able to calculate the per day relaxation level of each person according to the equations depicted below. Therefore we compute a result per dimension and adding them we calculate the final daily relaxation score of the user. For each of the three dimensions we normalize the results in the scale of [0-10] and then multiply each of them with the respective factor. Adding the three results per user, per day we extract the daily relaxation level of each user. We should highlight that the values of the three dimensions are in three different scales. Therefore, in order to compute the result in one common scale we respect the following procedure:
1) Firstly we compute the standardized values of the items. This value is also called the normal deviate and it represents the distance of one data point from the mean, divided by the standard deviation of the distribution.
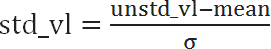
where std_vl is the standardized value and σ is the standard deviation.
2) Secondly we use factor weights to compute the unstandardized score.

where unstd_sc is the unstandardized score, wi is the weight score of the item i and dmi is the standardized value of the item i.
3) We find the minimum and the maximum of the scores and accordingly we translate everything in the scale of [0-10] by normalizing the results. Following the above mentioned procedure even if we have dimensions which are measured in different scales we produce a relaxation score in the scale of [0-10].
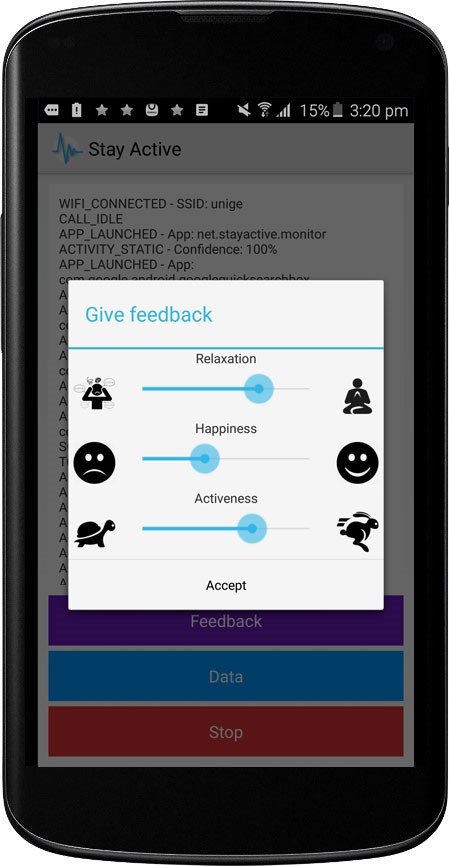
In order to evaluate the accuracy of the relaxation score, we asked the users to self-measure their stress level and to report it via an application. We could therefore update our algorithm until we obtained satisfactory results.